
Page 50 - Grapevine SeptOct 2021
P. 50
Around The Vineyard
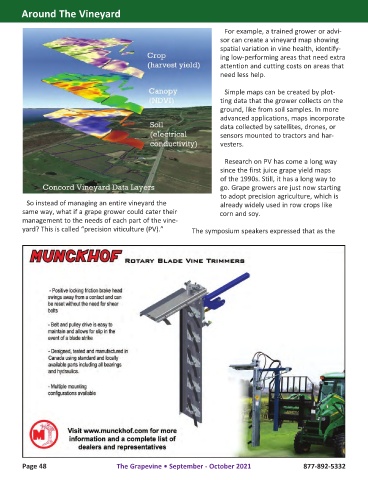
For example, a trained grower or advi-
sor can create a vineyard map showing
spatial variation in vine health, identify-
ing low-performing areas that need extra
attention and cutting costs on areas that
need less help.
Simple maps can be created by plot-
ting data that the grower collects on the
ground, like from soil samples. In more
advanced applications, maps incorporate
data collected by satellites, drones, or
sensors mounted to tractors and har-
vesters.
Research on PV has come a long way
since the first juice grape yield maps
of the 1990s. Still, it has a long way to
go. Grape growers are just now starting
to adopt precision agriculture, which is
So instead of managing an entire vineyard the already widely used in row crops like
same way, what if a grape grower could cater their corn and soy.
management to the needs of each part of the vine-
yard? This is called “precision viticulture (PV).” The symposium speakers expressed that as the
Page 48 The Grapevine • September - October 2021 877-892-5332
Grapevine Main Pages GV091021_Layout 1-1 .indd 48 8/19/21 2:26 PM